Axiom
Integrate Gen0Sec with Axiom for distributed tracing and observability using OpenTelemetry spans.
Overview
Axiom provides powerful observability capabilities for Gen0Sec deployments, enabling you to collect, analyze, and visualize OpenTelemetry spans for distributed tracing and performance monitoring.
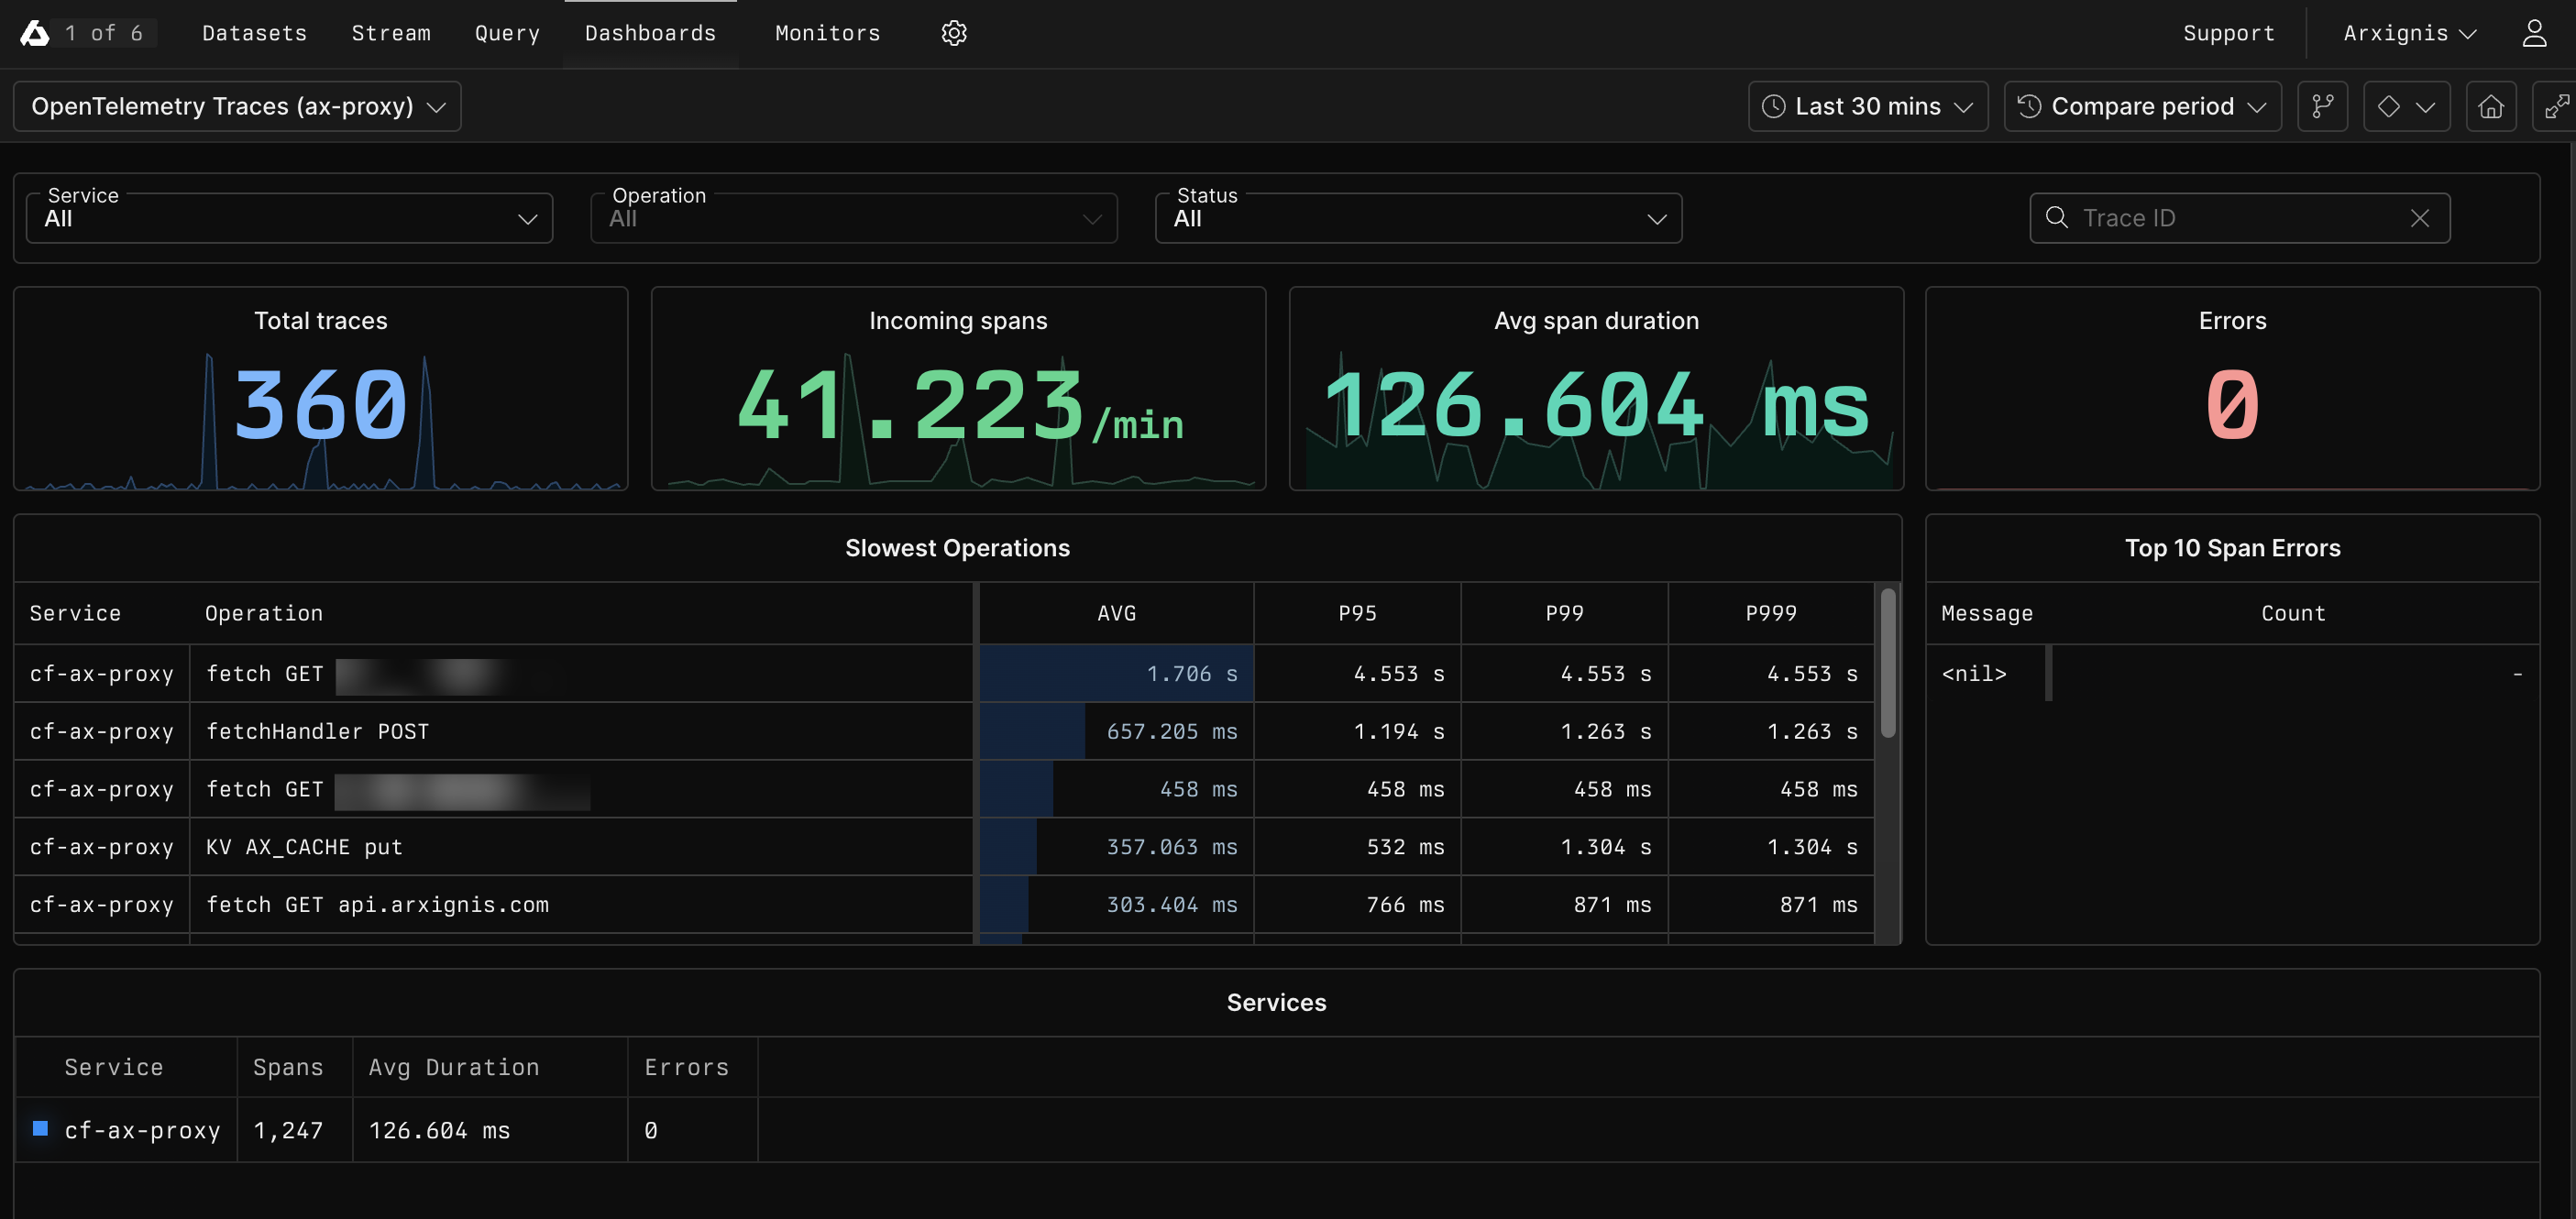
OpenTelemetry Traces dashboard showing performance metrics, span rates, and slowest operations for the ax-proxy service
Key Features
🔍 Distributed Tracing
- OpenTelemetry span collection and storage
- Custom security event spans
- Performance data tracing
- Real-time threat intelligence spans
📈 Advanced Analytics
- SQL-based query language for span analysis
- Custom dashboards and visualizations
- Historical data retention and analysis
- Anomaly detection and alerting
📊 Trace Management
- Centralized span collection and storage
- Structured span attributes with custom fields
- Trace correlation and analysis
- Compliance and audit trail support
⚡ Real-time Monitoring
- Live dashboard updates
- Custom alerting rules
- Performance monitoring
- Security event tracking
Setup and Configuration
Prerequisites
- Axiom Account: Active Axiom account with API access
- API Token: Axiom API token with write permissions
- Dataset: Configured dataset for OpenTelemetry spans
Installation
-
Get your Axiom credentials:
# Your Axiom API tokenAXIOM_TOKEN="your-axiom-api-token"# Your Axiom organizationAXIOM_ORG="your-organization"# Your dataset nameAXIOM_DATASET="gen0sec-spans" -
Configure Gen0Sec integration:
{"observability": {"axiom": {"enabled": true,"api_token": "your-axiom-api-token","org": "your-organization","dataset": "gen0sec-spans","span_interval": 60}}} -
Enable metrics collection:
# Set environment variableexport AXIOM_ENABLED=trueexport AXIOM_TOKEN="your-axiom-api-token"export AXIOM_ORG="your-organization"export AXIOM_DATASET="gen0sec-spans"
OpenTelemetry Spans
Security Spans
| Span Name | Description | Attributes |
|---|---|---|
security_check | Security threat detection | source_ip, threat_type, severity, action |
request_analysis | Request analysis by Gen0Sec | source_ip, status, response_time |
threat_block | Request blocked due to threat | source_ip, reason, threat_score |
api_request | Gen0Sec API request | endpoint, status, response_time |
Span Events
{
  "name": "security_check",
  "trace_id": "1-5f3b3b3b-3b3b3b3b3b3b3b3b",
  "span_id": "3b3b3b3b3b3b3b3b",
  "parent_id": "3b3b3b3b3b3b3b3a",
  "start_time": "2024-01-15T10:30:00Z",
  "end_time": "2024-01-15T10:30:00.045Z",
  "duration_ms": 45,
  "attributes": {
    "source_ip": "192.168.1.100",
    "threat_type": "malware",
    "severity": "high",
    "action": "blocked",
    "user_agent": "Mozilla/5.0...",
    "request_path": "/api/v1/data",
    "response_code": 403
  }
}
Custom Queries
Threat Analysis
SELECT
  attributes.threat_type,
  COUNT(*) as count,
  AVG(attributes.severity_score) as avg_severity
FROM gen0sec-spans
WHERE _time > now() - 1h
  AND name = 'security_check'
GROUP BY attributes.threat_type
ORDER BY count DESC
Performance Monitoring
SELECT
  attributes.endpoint,
  AVG(duration_ms) as avg_response_time,
  P95(duration_ms) as p95_response_time,
  COUNT(*) as request_count
FROM gen0sec-spans
WHERE _time > now() - 1h
  AND name = 'api_request'
GROUP BY attributes.endpoint
Dashboard Configuration
Security Overview Dashboard
Create a comprehensive security dashboard with the following panels:
-
Threat Detection Overview
- Total threats detected (last 24h)
- Threats by severity
- Top threat sources
-
Performance Metrics
- API response times
- Request volume
- Error rates
-
Geographic Distribution
- Threats by country
- Blocked IPs by region
- Traffic patterns
Alert Configuration
Set up alerts for critical security events:
# High severity threat alert
name: "High Severity Threat Detected"
query: |
  SELECT COUNT(*) as threat_count
  FROM gen0sec-spans
  WHERE _time > now() - 5m
    AND name = 'security_check'
    AND attributes.severity = 'critical'
condition: threat_count > 0
Best Practices
Data Retention
- Configure appropriate retention policies for different data types
- Archive historical data for compliance requirements
- Optimize storage costs with data sampling
Performance Optimization
- Use efficient queries with proper time ranges
- Implement data sampling for high-volume metrics
- Monitor query performance and optimize as needed
Security
- Secure API token storage
- Implement least-privilege access
- Regular token rotation
- Monitor access patterns
Troubleshooting
Common Issues
Spans Not Appearing
- Verify API token permissions
- Check dataset configuration
- Ensure OpenTelemetry tracing is enabled
- Validate network connectivity
High Latency
- Optimize query time ranges
- Use appropriate data sampling
- Check network performance
- Monitor Axiom service status
Data Loss
- Verify data retention policies
- Check API rate limits
- Monitor error logs
- Validate span format
Getting Help
- Axiom Documentation: docs.axiom.co
- Support: Contact Axiom support for platform issues
- Community: Join our Discord community
FAQ
Gen0Sec sends OpenTelemetry spans to Axiom for distributed tracing. This includes security check spans, API request spans, and custom security event spans with detailed attributes.
Use Axiom's SQL query interface to create custom queries, then save them as dashboards. You can create panels for threat analysis, performance monitoring, geographic distribution, and more.
Yes, Axiom supports data export in various formats including JSON, CSV, and through their API. You can also set up automated exports for compliance and backup purposes.
Spans contain timing information and trace context for distributed tracing, while logs are discrete event records. Gen0Sec sends OpenTelemetry spans to provide comprehensive trace-based observability.
Use span sampling for high-volume traces, implement appropriate retention policies, optimize queries with proper time ranges, and monitor usage patterns to identify optimization opportunities.
For more information, visit axiom.co or join our Discord community.